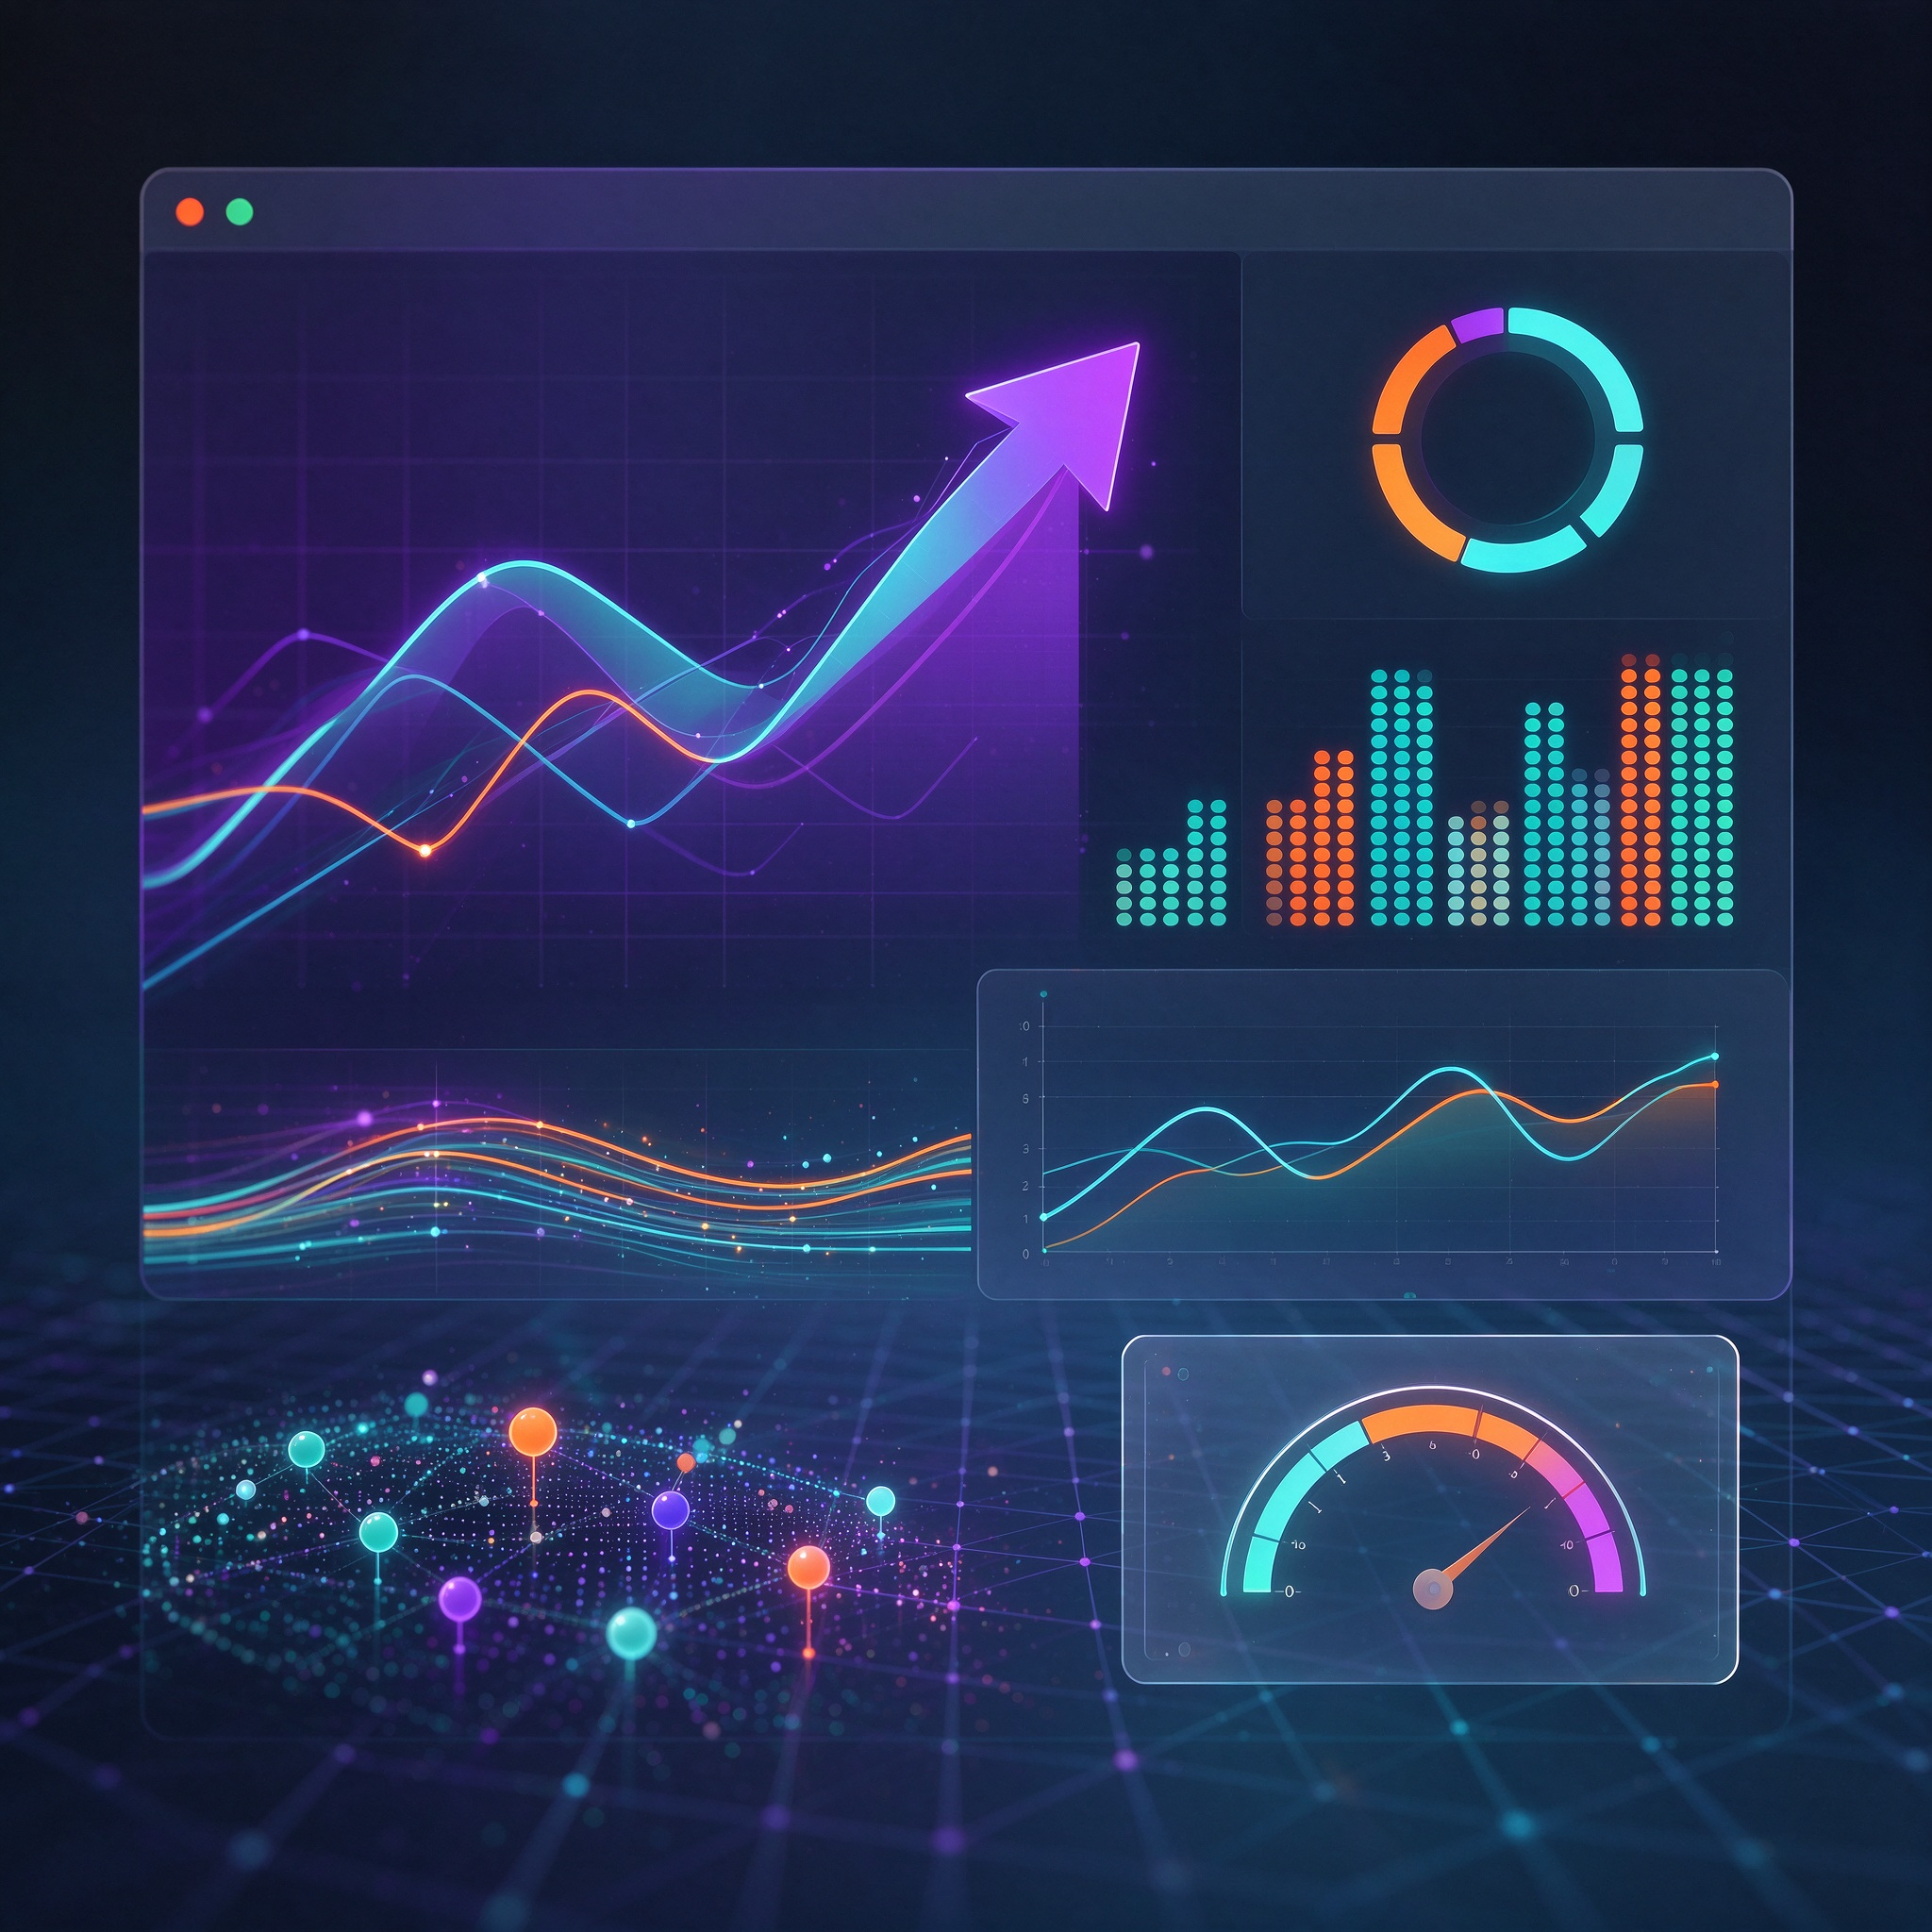
This content is designed for data presentation and explanation within web interfaces. It encompasses animations such as chart growth, incremental value updates, path tracing, area filling, node connectivity, ranking shifts, the gradual appearance of map regions, and the toggling of data metrics. Before production, we analyze the meaning of the data, the intended reading order, and the page layout—ensuring that animations serve solely to clarify changes and hierarchies without obscuring the underlying data. The workflow includes structuring data, scripting charts, defining visual mappings, creating keyframes, implementing interactive triggers, ensuring responsive alignment, and final delivery. Deliverables consist of animation specifications, data mapping documentation, trigger criteria, asset files, front-end implementation guidelines, static versions, and maintenance documentation. These animations can be linked to user actions—such as scrolling, clicking, filtering, or hovering—and are tailored for various web components, including cards, dashboards, reports, and explanatory sections. In terms of collaboration, we prioritize label readability, contrast, colorblind accessibility, keyboard navigation, and compatibility with assistive technologies, ensuring that data remains fully legible once an animation concludes. Regarding performance, we carefully manage node counts, rendering frequency, and asset file sizes to prevent complex charts from negatively impacting page scrolling or initial load times. The quality assurance process covers data updates, filter switching, rapid replays, handling of empty or anomalous datasets, and the provision of simplified or static fallback states—ultimately ensuring that data animations in web design are accurate, clear, and easy to maintain.